
Rising Fuel Prices: How to Control Your Fleet's Fuel Costs
Before the US and Israeli strikes on Iran on 28 February, a litre of diesel cost around €1.57 on average across the European Union. In the week of 21 September it reached €2.226, the highest level since the European Commission began publishing these figures in 2005. That is 66 cents more per litre, an increase of more than 40% in seven months.
For a private driver, this means a few extra euros per tank. For a company with 10, 20 or 50 vehicles, it means thousands of euros a year that were not in the budget. And because fuel is usually a fleet's largest variable cost, it is also where a lack of control costs the most.
The price at the pump is out of a company's hands. What is in its hands is how many litres it buys, where it buys them, and whether it knows exactly where each one goes.
This article explains what happened to fuel prices in Europe in 2026, what the increase costs a typical fleet, where money is lost without anyone noticing, and which measures make a real difference to the bill. If you are looking for a broader guide on consumption, we have a dedicated article on how to reduce fleet fuel consumption.
Contents
- What Happened to Fuel Prices in Europe in 2026
- What the Increase Costs a Fleet
- Where Fleets Lose Money on Fuel Without Noticing
- Six Measures to Reduce the Impact on Your Fuel Bill
- How FleetMax Helps
1. What Happened to Fuel Prices in Europe in 2026
The US and Israeli strikes on Iran at the end of February put the Strait of Hormuz at risk, a route for around 20% of the world's seaborne oil. Before the offensive, Brent crude was trading near 73 dollars a barrel. In March it reached 118 dollars and stayed mostly above 100 until early June. It fell back to around 72 at the end of June, but has been climbing again since July and is back above 100 in September.
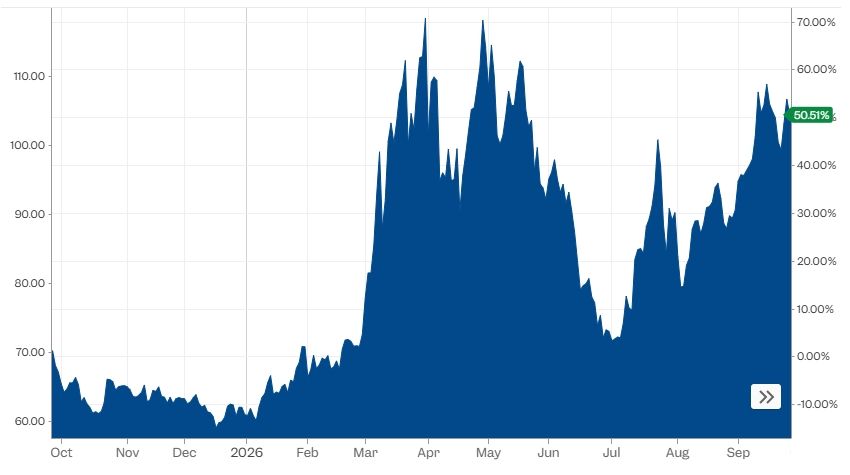
Brent crude oil price, in US dollars per barrel. Source: Markets Insider.
The effect reached European pumps within weeks. By early April, the EU average diesel price had already climbed 54 cents. Since then it has moved up and down from week to week, and in September it set new records.
| Date | EU average diesel (weighted) | Change since February |
|---|---|---|
| Before the conflict (Jan–Feb) | €1.57/L | Baseline |
| 6 April | €2.11/L | +€0.54 |
| 14 September | €2.159/L | +€0.59 |
| 21 September | €2.226/L | +€0.66 |
The EU average hides large differences between countries. In the same week of 21 September, diesel cost €1.21 in Malta and €2.58 in the Netherlands, more than double.
| Country | Diesel, week of 21 September |
|---|---|
| Malta | €1.210/L |
| Italy | €2.281/L |
| France | €2.383/L |
| Germany | €2.457/L |
| Netherlands | €2.579/L |
Three details matter particularly to fleet managers.
- Diesel is now more expensive than petrol. In the week of 21 September, the EU average for diesel was 13 cents a litre higher than for petrol. Part of the reason is refining. According to ECB estimates, the refinery margin on diesel rose from about €0.10 a litre in February to €0.41 in mid-September. Commercial fleets, mostly diesel, are hit hardest.
- Volatility is weekly. In the week to 21 September alone, the EU average for diesel rose by almost 7 cents. An annual budget built on a fixed price per litre goes out of date within weeks.
- Government relief varies from country to country. Germany has renewed its fuel tax cuts, Spain has extended its VAT cuts and a per-litre subsidy for transport operators, and France has expanded aid for professional drivers and sectors such as construction. These measures are temporary, cover only part of the increase, and can be revised at any time. It is worth checking which ones apply to your fleet in each country where it operates.
Analysts do not expect a quick return to February prices. The European Commission has warned that energy prices will not return to normal as soon as the conflict ends, and the EIA considers Brent above 120 dollars possible if the disruption in Hormuz persists.
2. What the Increase Costs a Fleet
To give a sense of scale, take a fleet of 20 diesel vans, each covering 30,000 kilometres a year at an average of 7 litres per 100 km. The fleet uses 42,000 litres a year.
| Scenario | Price per litre | Annual fleet cost | Annual cost per vehicle |
|---|---|---|---|
| Before the conflict (Jan–Feb) | €1.570 | €65,940 | €3,297 |
| Week of 21 September | €2.226 | €93,492 | €4,675 |
| Difference | +€0.656 | +€27,552 | +€1,378 |
The same fleet, with the same kilometres and the same drivers, now spends more than €27,000 a year extra on fuel alone.
The calculation also works the other way round, and that is where the opportunity lies. With diesel at €2.226, every percentage point of consumption you cut is worth around €935 a year for this fleet. A 5% reduction, a realistic target with management measures, is worth more than €4,600 a year.
To run this calculation for your own fleet, multiply the litres used last year by the price difference. The hard part, in most companies, is knowing how many litres were actually used, and by which vehicle.
3. Where Fleets Lose Money on Fuel Without Noticing
When diesel cost around €1.57, small inefficiencies went unnoticed in the monthly total. At €2.226, the same inefficiencies cost more than 40% extra. Almost all of them have the same root cause. The company knows the total on its fuel card statement, but not what happens vehicle by vehicle.
| Source of loss | How it shows up | Why it goes unnoticed |
|---|---|---|
| Above-normal consumption | A vehicle uses 9 L/100 km when it should use 7 | Without kilometres linked to each refuelling, consumption is never calculated |
| Overdue maintenance | Dirty filters, under-inflated tyres, injectors in need of a service | The rise in consumption is gradual and nobody compares it with the history |
| Irregular refuelling | Litres above tank capacity, refuelling at weekends or far from the work area | The fuel card statement arrives as a spreadsheet and nobody reads it line by line |
| Unplanned use | Detours, unauthorised private use, large vehicles on small jobs | Kilometres are not compared with the work carried out |
| Choice of filling station | Always refuelling at the same station, whatever the price | The difference per litre looks small on a single refuelling |
The underlying problem is not a lack of data. Fuel cards record the date, station, litres and amount of every refuelling. The problem is that this data sits in a separate file for each provider, apart from kilometres, maintenance and drivers. Without cross-checking them, a vehicle that uses almost 30% more fuel than normal looks exactly like all the others on the statement.
4. Six Measures to Reduce the Impact on Your Fuel Bill
No company controls the price of Brent. But there are measures that reduce the litres bought and the average price paid per litre.
4.1 Measure the Real Consumption of Each Vehicle
This is the starting point for everything else. Every refuelling should be linked to the vehicle and its odometer reading at the time, so that consumption can be calculated in litres per 100 km. With that figure, each vehicle can be compared with the reference consumption for its model and with identical vehicles in the fleet.
In the simulation above, a single van using 10% more fuel than normal costs around €467 a year extra. Three vans in that situation add up to around €1,400.
4.2 Treat Consumption Deviations as Maintenance Alerts
A rise in consumption without a change of route is often the first sign of a mechanical problem. Tyre pressure, air filters, injectors or a sticking brake are common causes. Keeping to the service schedule is, right now, also a fuel-saving measure. We covered this in detail in our article on fleet maintenance management.
4.3 Review Fuel Card Statements Every Month
Irregular refuelling is rarely dramatic. It is a few extra litres in a tank, a refuelling on a Saturday, or a vehicle that fills up twice on the same day. Checked one by one, these are hard to spot. Checked in bulk, with simple rules, they stand out:
- Litres above the tank's capacity
- Refuelling outside working hours or on days without work
- Intervals between refuellings that do not match the kilometres driven
4.4 Choose Where and at What Price You Refuel
In a fleet, a difference of a few cents per litre between stations is repeated in every refuelling of every vehicle. Two simple measures make a difference. The first is to point drivers to the cheapest stations in the areas where they work, using national price comparison services such as France's official fuel price website or the data published by Germany's Market Transparency Unit for Fuels. For fleets working near borders or on international routes, the gap between neighbouring countries can be worth even more. The second is to review your fuel card terms. At current prices, a better negotiated discount per litre is worth more than it was a year ago.
4.5 Match Vehicles to the Job, and Improve Driving
In a fleet with different models, the same job can cost twice as much in fuel depending on the vehicle used. Assigning the most efficient vehicles to the drivers and jobs with the most kilometres is a saving that requires no investment. The same reasoning applies to routes, trips that could be combined, and shared vehicles that travel almost empty.
In fleets with electric vehicles, the rise in diesel makes it even more worthwhile to give them the longest daily routes their range allows.
Driving style also matters. Idling, harsh acceleration and high motorway speeds increase consumption noticeably, and they are habits that can be corrected with training and follow-up. We shared practical tips in our article on how to reduce fleet fuel consumption.
4.6 Budget With Scenarios, Not a Fixed Price
With weekly swings of several cents, the fuel budget should be reviewed every month. A simple approach is to work with three price scenarios, for example €2.10, €2.25 and €2.40 per litre, and track actual costs against them. That way, management knows in advance what another increase will cost and can pass it on to customer prices before margins suffer.
5. How FleetMax Helps
To put all the measures above into practice, you need refuelling, kilometres, maintenance and drivers linked to each vehicle, in one place. In a spreadsheet, that is possible with three vehicles. With twenty, and statements from different providers every month, it stops being workable.
What the Platform Solves
Automatic import of fuel card statements. The fuel card statement from your fuel supplier is imported as it arrives, the columns are mapped only once, and each refuelling is automatically assigned to the right vehicle. The same applies to toll providers and other suppliers. What used to take hours of manual work becomes a monthly import.
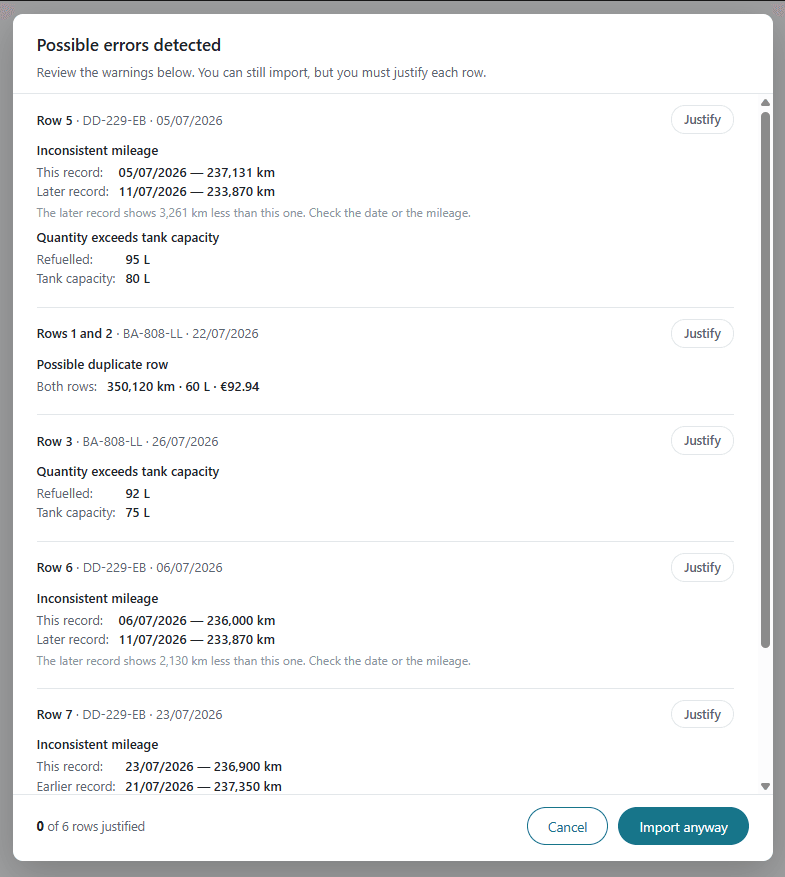
During the import, the system automatically flags inconsistent records:
- Odometer readings that do not match the previous and next refuellings of the same vehicle
- Distances that are impossible for the time elapsed, such as 1,900 km a day in a service vehicle
- Litres above the tank's capacity, such as 90 L in a vehicle with a 60 L tank
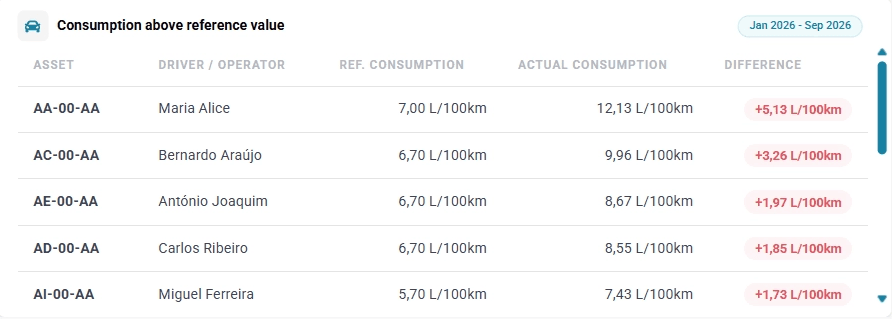
Real consumption per vehicle, compared with the reference. FleetMax cross-checks the litres of each refuelling with the kilometres driven, read by GPS or entered by the driver, and calculates real consumption. Each vehicle can have a reference consumption, and the dashboards highlight those above it. That is how a leak, a fault or an irregular refuelling shows up before the end of the quarter.
Cost rankings and vehicle comparison. The dashboards show the vehicles and drivers with the highest costs, the cost per kilometre (€/km) and the total cost of ownership (TCO). When one vehicle stands out from the rest of the fleet, that is where the investigation starts.
Maintenance and reminders in the same system. Unusual consumption can be checked against the vehicle's service history, and reminders make sure services are not overdue at a time when every litre counts.
Expense claims in the app. When a driver refuels without the fuel card, they submit the expense claim with the receipt through the app. The cost goes into the same history and is not left out of the accounts.
No software lowers the price of diesel. What changes is that the company stops looking only at the total bill and starts knowing, vehicle by vehicle, where it is overspending. With diesel above €2 a litre, that difference is worth thousands of euros a year.
This article is for information purposes only. Prices are EU averages at the time of publication and vary by country, station, brand and week. The simulation uses illustrative assumptions and does not replace an analysis of each fleet's real data.